
Table of Contents
Preface
……………………………………………………………………2
1. Introduction ………………………………………………………….5
2. Price Level …………………………………………………………….7
3. Public Finance ……………………………………………………..14
4. Foreign Trade………………………………………………………..19
5. Monetary Aggregates and Indicators……………………………25
6. Investment…………………………………………………………….28
7. Special Issues…………………………………………………………32
8. Statistical Annexes………………………………………………….35

The Ethiopian Economic Association has
been publishing its “Annual Report on the Ethiopian Economy” since 2000. The annual
report, a flagship publication of the Association, provides an independent
analysis of the performance of the economy in addition to detailed discussions
on particular sectors chosen to be the focus area for the year. While that
report has served this purpose very well, it has two fundamental drawbacks. The
first is the fact that owing to lack of timely data, the analysis usually has a
two year lag period. This delay is bound to reduce the usefulness of the
analysis for immediate policy interventions. The second and related drawback is
that even if data is available on a timely basis, there is a lot of information
that annual data hides that can be available from shorter frequency data sets
such as monthly or quarterly data. While monthly data is almost non existent in
incomplete, that can be used for a meaningful short term analysis. The aim of
preparing this quarterly report is to use this available quarterly data set in
order to fill the analytical gap that is felt in the annual report.
The availability of up-to-date data on a
regular basis along with a thorough analysis of this data is crucial to make an
informed and timely adjustment on major macroeconomic policies. Paucity of data
has rendered timely macroeconomic analysis in
making rapid and informed policy interventions in periods of macroeconomic
shocks. This has significantly reduced the flexibility and effectiveness of
macro policy at the national level, especially in periods of economic stress.
The timely availability of macroeconomic data and analysis in the public
domain, therefore, is valuable not only in enhancing our understanding of macroeconomic
phenomena but also in enabling policy makers to make informed policy decisions
and enhancing stakeholders’ participation in the policy making process.
Moreover, the importance of quarterly
performance can be judged by the fact that the annual economic performance is a
cumulative result of quarterly performances. A systematic concentration of
economic activities on some specific quarters provides useful information about
the nature of an economy, resource utilization and distribution.
Understanding such a pattern helps in
making informed policy interventions. Thus, it is very useful to systematically
compile, and analyze quarterly data on major macroeconomic indicators in the
country.
Towards this end, the Ethiopian Economic
Association/Ethiopian Economic Policy Research Institute is launching a
quarterly report on major macroeconomic indicators for
encourage a more informed and relatively timely debate on macroeconomic issues
in the country among academics, policy makers, donors and the general public.
Accordingly, we encourage users of this report to provide constructive comments
and criticisms both on the form and content of this report in order to help us
improve future reports.
This report is part of the work of the
recently established Macroeconomic Division of the Institute. The establishment
of the Division is financially supported by a consortium of donors including Irish
Aid, the African Capacity Building Foundation (ACBF), the Department for
International Development of the United Kingdom (DFID), the Norwegian Agency
for International Development (NORAD), the Swedish International Development
Agency (SIDA), the Netherlands Embassy in
(FES). The Association and the Institute are very grateful for their continuous
support. We would particularly like to mention Irish Aid and particularly
Patrick Empi and the other Irish Aid staff in
commitment to the Macroeconomic Division but also for significantly
contributing to the enrichment of the project idea and its implementation.
We also would like to thank various data
generating government institutions including the National Bank of
Ministry of Finance and Economic Development, the Ethiopian Investment
Authority, and the National Meteorological Agency for allowing us to use their
libraries and making some of their data available for analysis. We hope, in the
interest of knowledge and a better understanding of our economy, this
cooperation will broaden to include other government and non governmental
institutions in the future.
Berhanu
Nega (Ph. D)
Director,
Ethiopian Economic Policy Research Institute

Introduction

It is generally believed that in a well
developed capitalist economy, the economic performance of a country for two
consecutive quarters in a given fiscal year suffices to tell whether the
economy is in a recession or not. A timely determination of the health of the
economy allows policy makers to use the various policy instruments they have to
try and chart a more desirable course for the economy. Quarterly data also
provides important details about the performance of individual economic sectors
with seasonal variations. For example, in rain dependant agriculture such as
in the first quarter more or less determines the total value-added in the
sector for the whole fiscal year. Closely related to this, in
fourth quarters than in the second and third quarters witnessing the strong
association between price levels and food availability above all other
determinants of inflation. About 48% (sometimes as high as 59%) of the capital
budget of the Ethiopian government is utilized during the fourth quarter and
this has serious implications on resource allocation and efficiency. Hydroelectric
power that is generated in the first and second quarters is not sustained in
the third and fourth quarters. All these variations provide us with a richer
understanding of the operation of the economy.
Some of the indicators considered in this
issue are brief. Future issues of this report will update the already available
information and will cover macroeconomic indicators in more detail. This maiden
report incorporates data and analysis on selected variables on quarterly time
series basis. In order to highlight some of the salient issues that emerge in a
quarterly data analysis and identify systematic trends, this report will
provide long term time series analysis on quarterly data. Moreover, it will take
some sectors for a more in depth discussion when particularly noteworthy events
occur in that sector during the quarter under analysis. Furthermore, future
reports will incorporate other indicators that are not covered in this issue as
the availability of data permits.
This report is divided in to seven
sections. The next section deals with price developments which is followed by
public finance in section three. Sections
aggregates, and investment, respectively. The last section of the report deals
with energy issues in the “Special Issues” section of the report. The statistical annex of the report provides
detailed quarterly data on a variety of indicators.

 Price Level
General Quarterly Trend
It is usually maintained that inflation in
in times of war and drought, the official record of inflation in the country has
shown a relatively stable trend, remaining within single digits in normal years
and even showing a negative value (deflation) in some years.
It
is clear from the data that price levels in the country are heavily dictated by
food production. This is evidenced by the systematic association between the
price level and seasonal variation in crop production. The first quarter (July-
September), which is the rainy season in the country, is the planting period for
most food crops. During this period, there is a relative shortage of food as
peasants themselves are facing a depletion of their stock. As food comprises 60%
of the share in the basket of commodities in calculating the consumer price
index (CPI), the relative shortfall in food supply during this quarter results
in a relative rise in price levels compared to previous quarters.
The second quarter (October – December) is
a good period for food availability as crops reach their edible stage and as it
is harvest time in some areas. This quarter is also a period when farmers or
traders having accumulated stocks from the previous year start selling
especially if they expect that current harvest to be good. The third quarter
(January to March) is generally the period for farmers to complete harvesting.
Thus, price level in these two quarters is relatively low because of the
availability of crops. During this period, the terms of trade is in fact biased
against producers particularly because small holders, who dominate the
agricultural sector in the country, have to sell a significant portion of their
crop to settle their debts, which they incur in order to buy fertilizers and
other inputs.
The fourth quarter (April – June) is the dry
season. It is a period of intense tilling and crop stocks are depleted. Thus,
price starts to rise. In years of good belg
harvest, price levels become lower than the normal average.
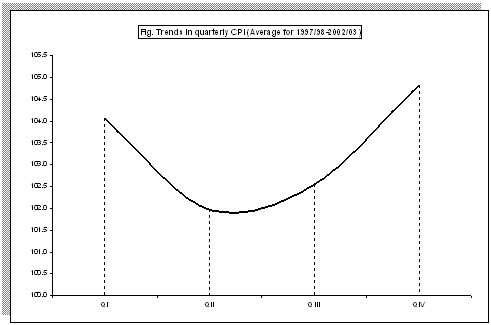
As can be seen from Figures 2.1a and 2.1b,
quarterly price behavior is more of a supply-side phenomenon. The graph (2.1a)
shows the average national price level of each quarter for the period 1997/98
to 2002/03. It depicts that price levels, on average, are 2% higher in the
first and fourth quarters than in the second and third quarters. The respective
comparison rate for food index is 4%. A similar trend prevails for
The pattern that is observed above for the
six year average is consistent with the quarterly trend of prices during the
period 1997/98:Q1 to 2002/03:Q4 save for a few exceptional years. One such
exception is 2002/03 where prices showed an unusually upward trend due to the
catastrophic drought that occurred in the previous year. With this typical pattern maintained in other years, price levels
moved above the trend for the years 1998/99 and 1999/00 partly due to the
Ethio-Eritrean boarder conflict.
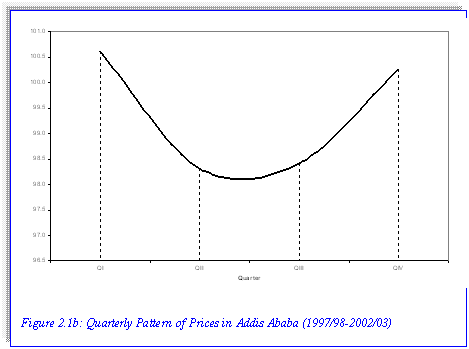
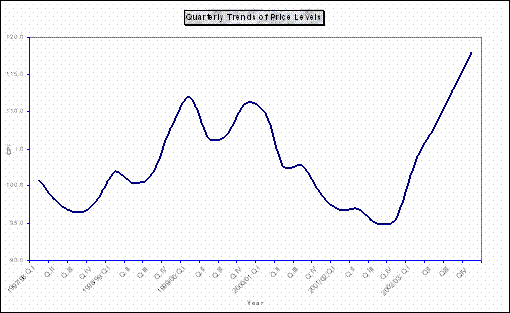 Figure 2.2: Quarterly Trends of Price Levels:
1997/98:Q1-2002/03:Q4
The six year average monthly price levels
show that prices start to sharply rise in July through August, begins to
decline in September, and reach their lowest level in December, which is
exactly the end of the harvest period. The price level starts to rise again after
December until it reaches the maximum at the end of the fourth quarter in June.
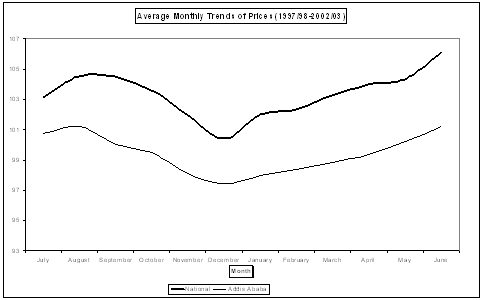
Figure
2-3: Monthly Trends of Prices (1997/98-2002/03)
INFLATION RATES
The national general price level has been
rising at an average (inflation) rate of 0.75% per quarter during the period
1997/98-2002/03, that is, for the last twenty four quarters. Price levels for
food and non-food items have been increasing at a quarterly rate of 1.1% and
0.1%, respectively. Food items, with a 60% share in the CPI, accounted for 95%
of the quarterly, and 87% of annual inflation.
Table
2.1a: Average Quarterly Inflation at a National Level
CPI
Food
Non-food
1997/98:I-2002/03:IV
2002/03:I-IV
1997/98:I-2002/03:IV
2002/03: I-IV
1997/98:I-2002/03:IV
2002/03:I-IV
Share
(weight)
100
100
60.005
60.005
39.95
39.95
Inflation
Rate
0.75
5.4
1.1
8.2
0.1
0.6
Weighted
inflation Rate
0.74
5.2
0.7
5.0
0.04
0.23
Share
in inflation
100
100
95
95.6
5
4.4
Source: Central Statistics Authority and
EEA/EEPRI staff computations.
As it is evidenced by Figure 2-4 below,
the price index for non-food items is relatively stable over the last 24
quarters. Any inflationary or deflationary pressure, if any, is more or less
associated with fluctuations in the food price index. This situation clearly
supports the view that price trends in
food supply.
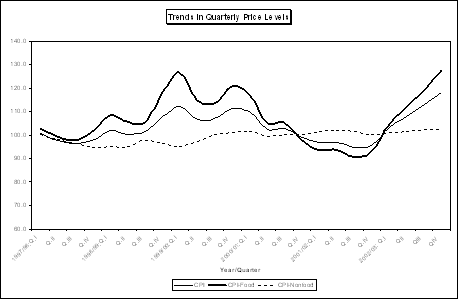
Figure
2-4: Trends in Quarterly Price Levels
In terms of price stability over the years,
the first quarter is found to be the most stable with a percentage change of
0.8% while the fourth quarter is found to be the most unstable with a
percentage change of 4.5%[1].
This indicates that inflationary trends are higher in the fourth quarter than
in other quarters. While inflation is heavily determined by availability of
food in general and crop production in particular, the high inflationary
pressure in the fourth quarter for successive years implies that the relative
shortage of food is dynamically deteriorating in the forth quarter. Some of the
fluctuation could be minimized with a comprehensive agricultural marketing
strategy that allows for smoothening out prices over the cycle.
Table 2.1b: Average Quarterly
Inflation for
Ababa
CPI
Food
Non-food
1997/98:I-2002/03:IV
2002/03:I-IV
1997/98:I-2002/03:IV
2002/03:I-IV
1997/98:I-2002/03:IV
2002/03:I-IV
Share
(weight)
100
100
43
43
57
57
Inflation
Rate
0.3
2.3
0.4
4.9
0.2
0.3
Weighted
inflation Rate
0.3
2.3
0.2
2.1
0.1
0.3
Share
in inflation
100
100
66.7
91.3
33.3
8.7
Source:
Central Statistics Authority and EEA/EEPRI staff computations.
Even for
basket of commodities considered for CPI is 43% compared to the national
average of 60%, quarterly inflationary trends are mainly governed by prices of
food products. For the last 24 quarters, about
67% of the quarterly inflation in the City has been generated by changes in the
price of food items. This figure reached 91% in the 2002/03 fiscal year. One interesting observation noted is that the
average quarterly inflation rate for the country for the last 24 quarters (6
years) is more than double the average inflation for
Ababa
both is less than 1%. The average quarterly inflation rate for
Ababa
are 0.3% and 0.75%, respectively.
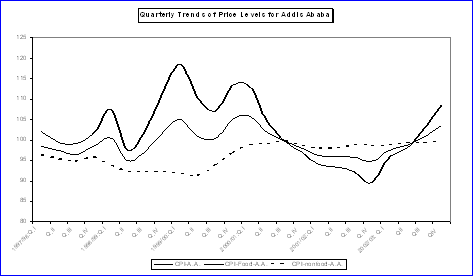
Figure
2.5: Quarterly Trends of Price Levels for
The
annual inflation rates for
and
are, respectively, 2.7%, and 0.7%.
About 87% and 22% of the annual inflation
for
and
respectively, are explained by rises in prices of food items. Though much of the quarterly inflation for
Ababa
is explained by prices of food items, the annual average inflation is explained
more by prices of non-food items [See Table 2.1b]. While quarterly fluctuations in the general
price level are generated by prices of food items, a relatively long term, in
this case annual, changes are generated by prices of non-food items. That is, food
prices have shorter (quarterly) frequencies but non-food prices have longer
(annual) frequencies of fluctuation. This is unlike the pattern observed in the
national average price level where both quarterly and annual fluctuations are
dominantly generated by prices of food items.
To sum up, on the basis of official
figures, inflation in
supply-side phenomenon and quarterly fluctuations in price levels are
systematically generated by seasonal availability of food crops. While the
basic rationale to suppress inflation is to create a stable macroeconomic
environment for sustainable economic growth, such depressed level of inflation
and occasional deflation, however, are clearly on the minus side. This may indicate
a highly frozen wage rate and excessively prudent monetary and fiscal policies
in the country. It is in particular against peasants’ productivity in the sense
that they fail to sell at a reasonably fair price during bumper harvest. The
low price in general gives a room for some government expenditure policy
interventions at least through provision of public goods.

Public Finance

Expenditure
Bubbles at the Fourth Quarter
The role of government in an economy has
been one of the fiercely debated issues in economics. Clearly, complete laissez
faire that keeps away government from the economy is more a textbook issue than
a strictly applied principle. What is really at issue in the current debate is
the degree of intervention and the type of economic sectors that the government
can fruitfully intervene without becoming an obstacle in the operation of
private economic agents.
In
a typical developing country such as
the role of government in the economy is bound to be more than ensuring
stability. However, whether one prefers an activist or a minimalist state, a
government engaged in the development of a strong private sector requires a
sustainable and efficient system of public finance.
One of the measures for the performance of
the public sector is its fiscal performance. Hard-earned government revenue,
which is secured from taxation and, in the Ethiopian case, increasingly from
foreign loans and grants must be spent prudently and efficiently if it is to
contribute to the country’s development. A common principle of efficiency in
government capital expenditure is to ensure that one Birr worth of investment
should have a return more than one Birr in net present value. However, the
actual return from such investments may be far less than what is implied by the
equi-marginal principle due to misappropriation of resources. One of the
indications of such an inefficient use of resources is inappropriate timing in
the launching of projects.
In this respect, an analysis of quarterly
performance of government expenditure is important. In
48% of the capital expenditure, 33% of recurrent expenditure, and 38% of the total
expenditure are carried out in the fourth quarter. This figure reaches as high
as 59% for capital expenditure in some years. Since the major part of the
recurrent expenditure goes to wages and salaries, its quarterly distribution is
not skewed much as wages and salaries are usually paid on a regular basis. The rush by a public sector, which pays wages and salaries on a regular basis, to
dispose off budget outlay on capital projects in the last month of the budget
year (usually June) cannot be more than wastage.
It
is apparent from Figure 3.1 that the level of general expenditure at the fourth
quarter is always at its peak. This trend was not as pronounced, at least
during the last three years of the Derg
regime, as it is after 1992.
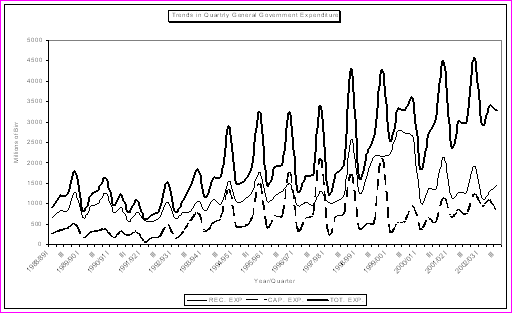
Figure3.1:
Trends in Quarterly General Expenditure
The share of the fourth quarter in general
government expenditure is always the highest of all the share of the other quarters.
But the pattern, as can be expected, is more pronounced for capital expenditure
while recurrent expenditure is relatively more even.
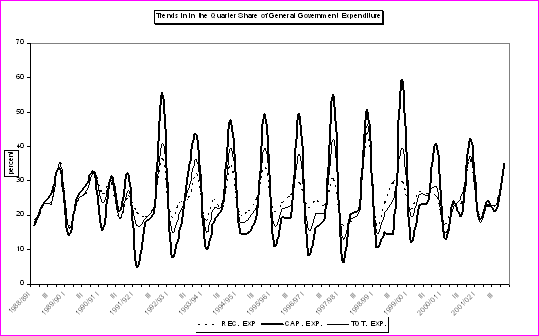
Figure3.2:
Trends in Quarter Share of General Expenditure
For the period 1991/92-2001/02, the
average share of the first, second and third quarters were, respectively,
11.3%, 19%, and 21.7%. Almost half of the activities under the capital budget
are accomplished in the fourth quarter. This is clearly a result of a rush to
spend the allotted money before the end of the budget year. Such a “fire buy”
is very likely to create all kinds of loopholes for embezzlement of public funds.
Even worse, capital projects that are accomplished in such a short period of
time are susceptible to quality problems leading to lower economic and social
returns. It is not uncommon to hear that some payments are effected at the
eleventh hour lest the budget expires and return to the federal treasury.
Table 3-1: Quarter Share in the General
Government Expenditure
Current Expenditure
Capital Expenditure
Total General
Government Expenditure
YEAR
Q1
Q2
Q3
Q4
Q1
Q2
Q3
Q4
Q1
Q2
Q3
Q4
1988/89
18.3
23.1
23.0
35.5
17.0
23.2
26.3
33.5
17.9
23.2
24.0
34.9
1989/90
17.1
24.1
26.1
32.7
14.3
25.0
28.5
32.2
16.5
24.3
26.7
32.6
1990/91
26.2
29.5
18.8
25.6
15.7
31.5
21.1
31.7
23.6
30.0
19.3
27.1
1991/92
20.8
19.6
23.2
36.4
5.2
17.9
21.3
55.6
17.1
19.2
22.8
40.9
1992/93
19.6
23.5
24.9
32.1
8.5
15.8
32.8
43.0
15.7
20.7
27.6
35.9
1993/94
18.6
24.6
22.3
34.5
10.9
18.3
23.3
47.5
15.6
22.1
22.7
39.6
1994/95
20.2
21.0
25.0
33.8
15.2
14.8
20.8
49.3
18.3
18.7
23.5
39.5
1995/96
21.2
23.5
25.9
29.4
11.7
19.5
19.5
49.3
17.3
21.9
23.2
37.6
1996/97
22.5
24.2
22.9
30.5
9.1
16.5
19.3
55.1
16.1
20.6
21.2
42.1
1997/98
17.3
18.0
20.6
44.0
7.4
20.2
21.8
50.6
13.7
18.8
21.1
46.4
1998/99
17.3
23.4
29.6
29.7
11.0
14.9
14.8
59.4
15.2
20.6
24.7
39.4
1999/00
21.6
26.7
26.3
25.3
13.0
22.7
23.7
40.6
20.1
26.0
25.8
28.1
2000/01
17.3
23.2
23.4
36.1
13.6
24.0
20.1
42.3
15.2
22.2
25.6
37.0
2001/02
20.5
22.6
22.9
34.0
19.2
24.2
21.4
35.2
18.5
23.3
23.0
35.2
Average:
1991/92-2001/02
19.7
22.8
24.3
33.3
11.3
19.0
21.7
48.0
16.6
21.3
23.8
38.3
average:
1988/89:90/91
20.5
25.6
22.6
31.3
15.7
26.6
25.3
32.4
19.3
25.8
23.3
31.5
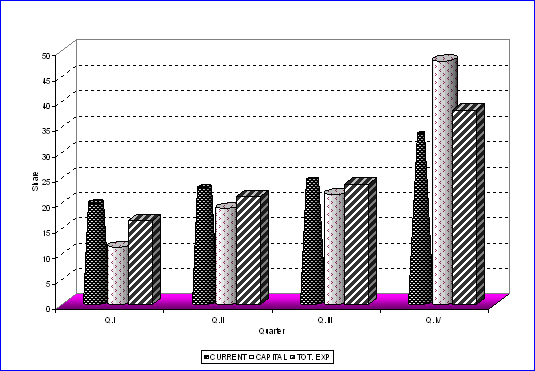
Figure3.3:
Average Quarterly Share of General Government Expenditure: 1991/92-2001/02
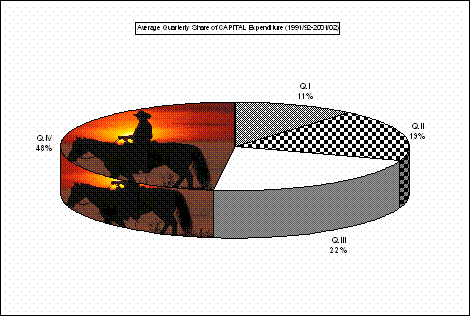
Figure3.4:
Quarterly Share of Capital Expenditure: 1991/92-2001/02
The reason for such unreasonably skewed
distribution of activities among quarters could be negligence, deliberate delay
to make sure that there is room for corruption, or it could be due to delay in
donors’ disbursement of agreed funds for a variety of reasons. Whatever the
case may be, it has a serious implication to the development endeavors of the
country and has to be addressed seriously.

Foreign Trade

Overall
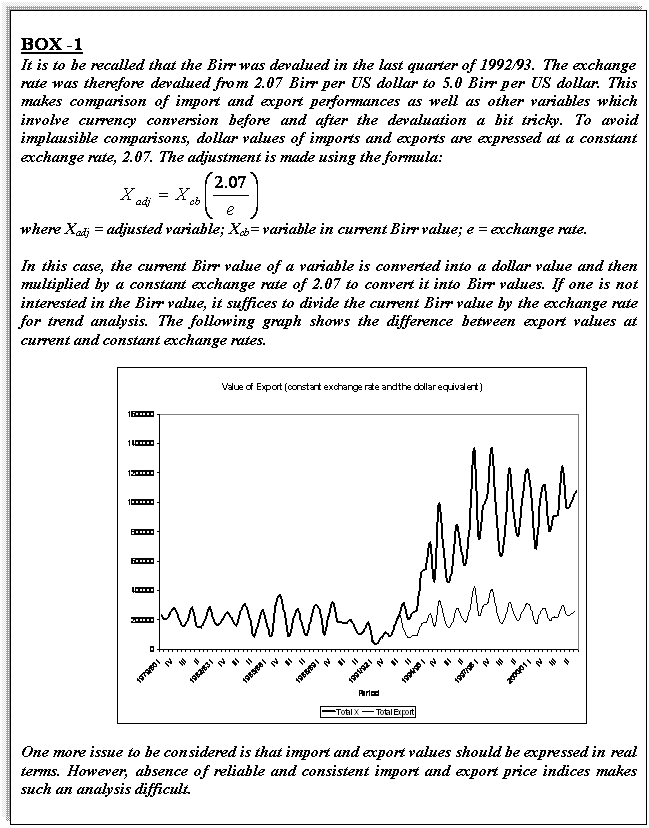
Total value of exports stood at 1.07
billion Birr at the existing exchange rate (258.6 million Birr at constant
exchange rate) in the third quarter of the year 2002/03. The value of imports
during this period was 4.07 billon Birr at the existing exchange rate (980.4
million Birr at constant exchange rate).
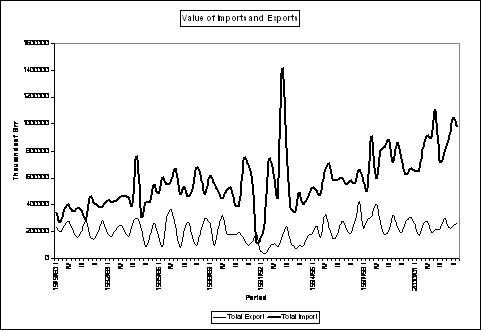
Figure4.1:
Value of Imports and Exports
The deep slump in imports in the fourth
quarter of the year 1990/91 in Figure 4-1 above is due to the civil war that
prevailed in that year. The unusually high upsurge in imports in the second
quarter of the year 1992/93 is due to adjustments for unrecorded aircraft
imports of Birr 510 million.

Exports
As it is apparent from Figure 4-3 below,
Ethiopian exports have long been dominated by one commodity, namely coffee. The
seasonality of coffee production also affects the overall export performance
and causes high seasonal fluctuations in the total export. The peaks that are
observed in the graph occur in the fourth quarter while the slumps occur during
the second quarter. The high dependence of the total export on coffee has
serious implications on the country’s export performance especially after the
world coffee price shock.
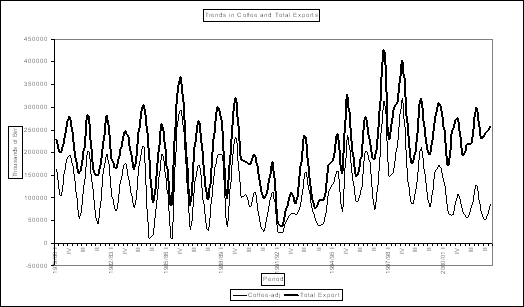
Figure 4.3: Trends in Coffee and Total Export
The share of coffee in the total value of
commodities exported between 1979/80 and 1990/91 was 57%. This share increased
to about 64% during the EPRDF period before the international coffee price declined
in 1998/99. Following this, the share declined progressively and the average
share for the period 1999/00 to the third quarter of the year 2002/03 was about
44%. During the last 12 quarters, this share declined to 35%. This decline in
the share of coffee in the total value of export is not due to an upsurge in the
value of other exportable commodities and diversification, but rather due to the
decline in the total value of coffee export as a result of a decline in the
price of coffee in the international market. This is witnessed by the fact that
the total value of exports declined due to the fall in proceeds from coffee
export. For the first seven years of the EPRDF period, that is, before the
price shock in 1998/1999, the value of exports used to grow at an annual rate
of 20.9%. For the following years (1998/99-2001/02), the value of total exports
of goods and services declined by an average annual rate of 6.4%. The highest
decline was 21.1% which is registered in 1998/99.
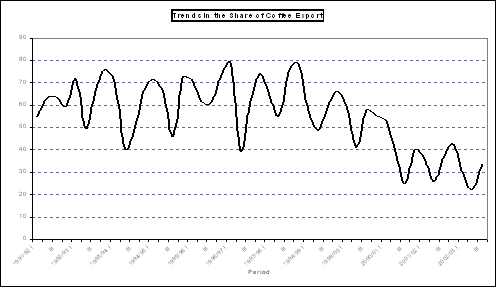
Figure
4-4: Trends in Quarterly Share of Coffee Export
Imports
The major change in the structure of
imports during the EPRDF period, compared with the Derge period, came from
miscellaneous components, and raw materials. The share of semi-finished goods
does not show much change, which implies that domestic industries still depend
on imported semi-finished goods as their major input. The share of capital
goods moderately declined from the Derge period average of 34% to 32.8% in the
EPRDF period. In particular, the share of capital imports for agriculture has
declined from the already low share of 2% during the Derge regime to 0.8%
during the EPRDF period.
Table 4-1: Share of Imports
by End-Use
1970/71:I-2002/03:III
1970/71:I-1990/91:IV
1991/92:I-2002/03:III
Raw
materials
3.0
3.6
1.8
Semi-finished goods
16.1
15.5
15.7
Fuels
14.5
15.0
15.7
Capital goods
33.4
34.0
32.8
Transport
13.1
13.6
13.3
Agricultural
1.6
2.0
0.8
Industrial
18.7
18.4
18.8
Consumer goods
30.7
30.9
29.4
Consumer durables
10.2
9.6
9.5
Consumer Non-durables
20.5
21.2
19.8
Miscellaneous
2.2
1.0
4.5
The Current
Account Balance
Foreign exchange earnings from exports of
goods and services used to cover about 83% of total imports for the imperial period.
The corresponding figure for the Derge period was 60%. For the last twelve
years, foreign exchange earnings from exports have financed only 52% of the
country’s imports. For the last five years, value of exports of goods and
services is only 46% of total imports of goods and services.
Traditionally, current account balance is
one of the target variables of prudent macroeconomic policies. An improvement
in the current account deficit is usually considered as a sound balance of
payment performance. The success of exchange rate policies (devaluation for instance)
is measured in terms of improvement in the current account balance.
However, improvements in the current
account balance may not necessarily be a result of sound export performance
over imports, which can be considered a healthy situation. Whenever an economy
faces a supply-side shock, domestic demand for imported goods declines.
Regardless of what happens to the export sector, the current account deficit
declines.
In
domestic economy, current account balance improves while during boom years,
current account deficit deteriorates. Figure 4-5 shows the direction of
correlation between GDP and current account deficit. Thus, most of the apparent
improvements in the current account deficit in the economy recorded so far are
results of domestic economy contraction than improvements in exports over
imports.
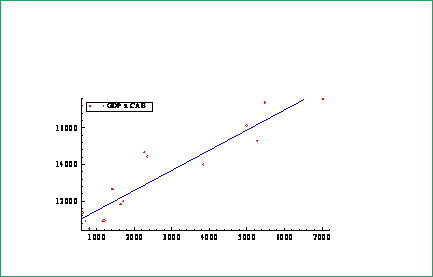
Figure
4-5: Correlation between GDP and Current Account Deficit

Monetary Aggregates

Money Supply
By the end of March 2003, narrow money and
broad money reached 16 billion Birr and 29.2 billion Birr. Saving deposits, demand deposits, and
currency outside banks accounted for 41.3%, 29.4%, and 25.5% of the money
supply, respectively, during the third quarter of 2002/03.
Table 5-1: Components of Money Supply (millions
of Birr)
2002/03
Q1
Q2
Q3
Narrow Money
(M1)
15543.2
15461.7
16000.4
Currency outside banks
6358.5
6716.2
7439.6
Net
Demand Deposits
9184.7
8745.5
8560.8
Quasi-Money
12609.2
12878.5
13161.1
Saving Deposits
11480.5
11737.8
12032.3
Time Deposits
1128.7
1140.7
1128.8
Broad Money (M2)
28152.4
28340.2
29161.6
Table 5-2: Components of Money Supply
(Share on Broad Money)
2002/03
Q1
Q2
Q3
Narrow Money
(M1)
55.2
54.6
54.9
Currency outside banks
22.6
23.7
25.5
Net
Demand Deposits
32.6
30.9
29.4
Quasi-Money
44.8
45.4
45.1
Saving Deposits
40.8
41.4
41.3
Time Deposits
4.0
4.0
3.9
Broad Money (M2)
100.0
100.0
100.0
Reserve money (currency in circulation
plus bank deposit at the central bank) reached Birr 12 billion at the end of
the third quarter of 2002/03. Actual reserve during the period was about 3.9
billion Birr. The ratio of narrow money to reserve money and that of broad
money to reserve (money multiplier) during the period were 1.33 and 2.42,
respectively.
With low demand for credits, excess
reserve reached 67.7% of actual reserve in the third quarter of 2002/03 from a level
of 61.5% in the first quarter of the same year.
Table 5-3: Reserves (millions of Birr)
2002/03
Q1
Q2
Q3
Reserve
Requirements
1221
1241.1
1271.2
Actual Reserve
3170.6
3255.1
3939.8
Excess Reserve
1949.6
2014
2668.6
Reserve Money
10296.1
10645.6
12040.4
Currency in circulation
7041.5
7294.4
8100.6
Banks deposit at NBE
3254.6
3351.2
3939.8
Credit
Seasonal variations in net credit claims
are more pronounced in the public sector than in the non-public sector. One interesting feature of net credit
claims is that changes in claims on the central government and non-central
government seem to be counter cyclical. It seems a tautology in the sense that if claims on the central government
increases, then the non-central government counterpart should finance it and be
a lender and claims on it will be reduced accordingly.
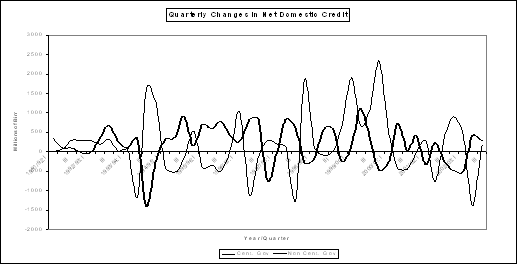 Figure 5-1: Quarterly Changes in Net Domestic Credit
Credit injections have been modest since
the second quarter of 2000/01. Domestic
credit stood at 26.8 billion Birr at the third quarter of the 2002/03 fiscal
year. The injection during the quarter was about 133 million Birr. Net credit
claims on central government and non-central government during the third
quarter of the fiscal year are, respectively, 15.2 billion Birr and 11.6
billion Birr.
Central government, the industrial sector,
and international trade claimed 33.3%, 11.4%, and 9.7%, respectively, of the
total outstanding loan in the third quarter. Domestic trade, housing and
construction, and the agricultural sector follow with respective shares of
7.8%, 7.2%, and 6%. About 60% of the outstanding loan granted to the domestic
trade sector is provided by private banks.
Interest Rate
For the last three decades, interest rates
in
rather a policy variable. The saving deposit rate was fixed at 6% during the
Derge period. It was also fixed at 11% for a brief period (less than 1 year)
and was back at 6%, during the EPRDF period.
Currently, the minimum deposit rate is fixed at 3% per annum while the
lending rate ranges between a minimum of 7.5% per annum and a maximum of 13%.
The average lending rate as of March 2003 has been 10.25%. The weighted average
treasury bills rate, the inter-bank rate, and average bond yield have been
1.26%, 7%, and 3.91%, respectively, during the third quarter of 2002/03.

Investment

Overview
The total capital of investment projects
approved by the Ethiopian Investment Authority between July 1991/92 and June
2002/03 was about 91.5 billion Birr. Out of this, the value of inactive
projects was about 3 billion Birr. Investment projects with a capital of 1.2
billion Birr were terminated before 2001/02. Thus, the cumulative capital of approved
investment projects as of 2002/03 is estimated at 87.3 billion Birr. Until
2001/02, investment projects that had started operation and those which were in
the implementation phase have a capital share of 29.1%, and 17.7%,
respectively. Investment projects with a capital share of 52% of the total
approved projects are presumed to be in “pre-implementation phase” or that
their status is not clearly known. Certainly,
the total amount of investment undertaken in the country, which is about 41
billion birr over eleven years or an average of 3.7 billion birr per year, is
extremely low given the size of the population of the country. In terms of the current population, the per
capita investment is about 60 Birr. What is also worrying about the investment
figures is that more than half of the investors interested in investing at one
time have either decided to wait or not pursue the project at all after going
through the process of getting the investment license.
The regional distribution of investment
projects has been skewed towards regions with a relatively better
infrastructure and major urban centers. To this end, Addis Ababa accounted for
about 55.7% of the total capital of investment projects approved until 2002/03
followed by Oromiya with an investment capital share of 17.8%.
(SENNP), Tigray, and Amhara regions are more or less in the same category with
a capital share of 6%. However, Somali, Gambella, and Harari regions have a share
of less than 1% in the total capital of investment projects.
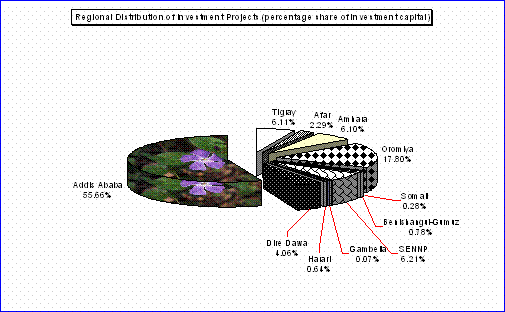
Figure3.2Regional
Distribution of Investment Projects
Quarterly
Distribution
The quarterly distribution of investment
projects is not influenced very much by seasons unlike other economic activities
except for some years with special incidence such as war. The third and fourth
quarters of the years 1998/99 and 1999/00 showed low performance in terms of
investment projects. This may be due to the Ethio-Eritrean conflict which took
place more or less about that time. One of the reasons for the absence of a skewed
distribution of investment projects among quarters may be due to the fact that approval
of investment projects does not necessarily imply actual implementation, both
in terms of making decisions to invest and the time lag between securing an investment
license and implementing a project.
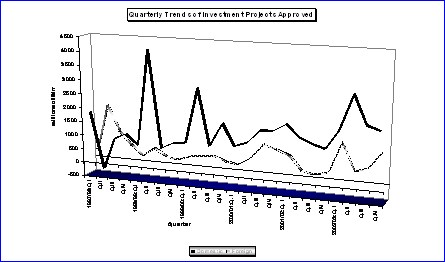
Figure6-.2:
Quarterly Trends of Investment Projects Approved
Table 6-1: Year-Quarter
Matrix of Capital of Investment Projects (Millions of Birr)
QI
QII
QIII
QIV
Total
1997/98
2191.2
1783.8
1986.7
1715.5
7677.2
1998/99
1010.8
4727.9
1020.1
1198.2
7957.1
1999/00
4365
2963
1630.3
2155.4
11113.7
2000/01
1330.4
1787.4
2866.1
2688
8671.9
2001/02
2712.0
2071.3
2756.3
1587.84
9127.5
2002/03
3263.1
3536.1
2691.9
3691.6
13182.7
Table 6-2: Quarterly
Distribution of Investment Projects (Percentage of capital of projects)
QI
QII
QIII
QIV
1997/98
28.5
23.2
25.9
22.3
1998/99
12.7
59.4
12.8
15.1
1999/00
39.3
26.7
14.7
19.4
2000/01
15.3
20.6
33.1
31.0
2001/02
29.7
22.7
30.2
17.4
2002/03
24.8
26.8
20.4
28.0
Average
25.1
29.9
22.8
22.2
In the fiscal year 2002/03,
total investment projects in all quarters. There is a significant leap in
investment for Dire Dawa in the second quarter. The capital of investment
projects approved for Dire Dawa in the second quarter was 21.5% of the total
capital of investment projects approved for the country. A cement factory,
bakery, construction, and engineering projects are the major items that boosted
the share of approved investment projects in Dire Dawa.
Oromiya, SENNPR, and Dire Dawa constitute the
highest share in the total capital of investment projects after
portion of this investment is accounted by public investment in electricity
supply. Public investment in the electricity sub-sector accounted for 88.7%,
46.2%, and 23.8% of the capital of total investment projects in SENNPR, Dire
Dawa, and Oromiya, respectively.
Table 6-3: Regional
Distribution of Investments During the Four Quarters of the Year 2002/03
Capital ‘000 Birr
Share (%)
QI
QII
QIII
QIV
QI
QII
QIII
QIV
Tigray
9365.6
45665.64
41136.55
62081.61
0.3
1.3
1.5
1.7
Afar
9480.4
14777
0
0
0.3
0.4
0.0
0.0
Amhara
29666
16620.8
52539.06
112979
0.9
0.5
2.0
3.1
Oromiya
334373.6
217563.4
445391.7
779151.4
10.2
6.2
16.5
21.1
Somali
0
7630.85
0
0
0.0
0.2
0.0
0.0
Benishangul-Gumuz
21445.3
0
86000
0
0.7
0.0
3.2
0.0
SENNP
212581.4
11494.96
49899.03
406537
6.5
0.3
1.9
11.0
Gambella
0
0
0
0
0.0
0.0
0.0
0.0
Harari
7097
17489.54
8738.56
8685.57
0.2
0.5
0.3
0.2
Dire Dawa
19569.3
759381.5
62839.04
262315.3
0.6
21.5
2.3
7.1
2542896
2445443
1945368
2059874
77.9
69.2
72.3
55.8
Not
Stated
76588.2
2.3
0.0
0.0
0.0

 Special Issues
Energy
The fiscal year 2002/03 witnessed a catastrophic
drought in
sector was expected to slump by more than 12% as major crop production is
estimated to fall by about 26%. As a result, real GDP was forecasted to fall by
about 4%. The forecast was made under the assumption that other sectors would
grow at a fairly normal rate. However, non-agricultural sectors, the industrial
in particular, sector were also adversely affected by power interruptions that
were prolonged for about four months with a one day per week complete interruption
throughout the country. Thus, the effect of power interruption in the fiscal
year and in fact in previous years has put a warning signal that the country
may be moving from rain-fed agriculture to “rain-fed industry” as the
economy switched to industry which will obviously be dependent on power from
hydroelectricity sources unless some corrective measures are taken. It is,
therefore, important to consider the quarterly trends of energy production from
hydroelectric power to draw some lessons.
In the 1960s,
estimated at about 128 million KWH per annum. About 53% of this energy was
generated by hydroelectric power (HEP) while the balance was secured from
thermal sources. Partly due to the world oil price shock and partly due to the
comparative advantage the country claims to have, the share of the HEP rose to
95% during mid 1980s. Nowadays, the share of HEP in the total electricity
generated is about 98% (This is the average for the EPRDF period).
However, the power supply which is
predominantly generated from HEP, fails to meet the ever growing demand. Even
worse, it fails to supply the whole year on a sustainable basis to its clients.
It cannot sustain delivering to the third and fourth quarters what it delivers
in the first and second quarters. As it is evidenced from Figures 7-1 and 7-2
below, although fluctuations in quarterly electricity generations in terms of
percentage seem to be stable over time except during some unusual occasions,
the absolute fluctuation is, however, widening. Fluctuations overtime seem to
be stable when measured in percentage. However, small deviations in terms of
percentage points these days are big in terms of values. They are small in
percentage terms because they are divided by higher bases.
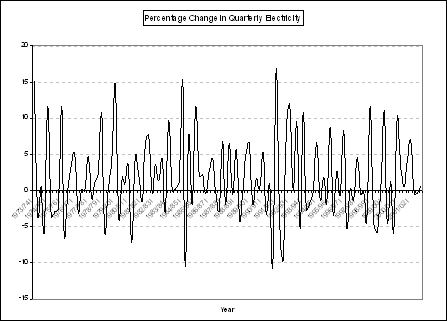
Figure
7-1: Percentage Change in Quarterly Electricity


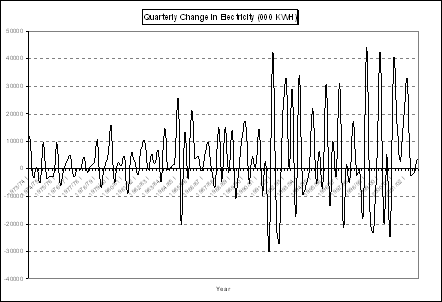
Figure
7:2: Quarterly Change in Electricity (‘000 KWH)
This situation forced the Ethiopian
Electric Light and Power Corporation to undertake power rationing for some
months of the fiscal year 2002/03. This was also practiced in previous years. In
a 52 billion Birr economy at current market prices (18 billion Birr at 1980/81
constant prices), a complete interruption of power throughout the country for a
day will result in production loss in that day estimated to be in the order of
10 to 15% of the GDP of the day. If the rationing had continued for a year,
there would have been interruption for about 52 days causing a 1.7 to 2.5 %
decline in real GDP.
Fortunately, the generous rainfall during
June – September, 2003 has rescued the economy from what would have been if
there had been a sustained and more frequent power interruption. But the
warning signal was clear: power is not something that should be totally put at
the mercy of nature. It calls for a short to long range national power
policy.

Statistical Annexes
ANNEX
A: Consumer Price Indices (2000=100): 1997/98:I-2002/03: IV
National
Period
CPI-General
CPI-Food
CPI-Nonfood
Period
CPI-General
CPI-Food
CPI-nonfood
1997/98:Q.I
100.8
103.0
100.2
1997/98:Q.I
98.5
102.1
96.4
Q.II
97.7
99.3
98.0
Q.II
97.5
99.6
95.4
Q.III
96.4
97.7
96.4
Q.III
96.4
99.1
94.7
Q.IV
97.7
101.4
94.9
Q.IV
98.4
101.6
95.8
1998/99:Q.I
101.8
108.4667
95.1
1998/99:Q.I
100.5
107.4
93.9
Q.II
100.3
105.6333
95.1
Q.II
94.9
97.5
92.3
Q.III
101.5
105.4333
97.9
Q.III
97.3
102.3
92.2
Q.IV
107.7
117.9
96.2
Q.IV
102.0
112.0
92.2
1999/00:Q.I
112.0
126.4333
95.2
1999/00:Q.I
105.0
118.6
91.8
Q.II
106.5
114.8333
97.3
Q.II
100.8
110.5
91.3
Q.III
107.0
113.3667
100.1
Q.III
100.4
107.1
93.8
Q.IV
111.2
120.4667
101.1
Q.IV
105.0
113.3
96.8
2000/01:Q.I
109.8
117.3333
101.5
2000/01:Q.I
105.8
113.2
98.7
Q.II
102.5
105.0667
99.5
Q.II
101.8
104.6
99.0
Q.III
102.7
105.1667
100.2
Q.III
99.8
99.7
99.8
Q.IV
98.8
97.96667
100.1
Q.IV
97.9
96.9
98.7
2001/02:Q.I
96.7
93.7
101.4
2001/02:Q.I
96.3
94.1
98.0
Q.II
96.8
93.56667
102.0
Q.II
96.1
93.5
98.1
Q.III
94.9
90.66667
101.5
Q.III
95.8
92.2
98.6
Q.IV
95.6
92.9
100.1
Q.IV
94.7
89.6
98.6
2002/03: Q.I
103.2
104.5
101.0
2002/03: Q.I
97.5
95.8
98.7
QII
107.9
111.8862
101.3
QII
98.8
98.1
99.4
QIII
112.8
119.1269
102.4
QIII
100.8
102.7
99.3
QIV
117.9
127.3655
102.4
QIV
103.6
108.4
99.9
Sources: Central
Statistical Authority and EEA/EEPRI computations.
Annex B: Value of Imports by End Use
(Millions of Birr): 1970:1-2002/03: III
1970/71 I
II
III
IV
1971/72
II
III
IV
1972/73 I
II
III
IV
RAW
MATTERIALS
4528
3191
5194
4780
5903
3864
5257
3193
5798
4801
3926
5085
SEMI-FINISHED
GOODS
19962
20576
24197
27047
18585
18928
20216
16861
17669
17322
19463
21809
FEULS
9580
5670
8887
10689
15020
9708
13710
9438
6183
6905
3990
13303
CAPITAL
GOODS
37152
36551
37126
33926
41193
47662
40277
46597
41746
38850
33202
35070
Transport
10049
9660
10696
9414
12316
12612
13387
12447
11209
14140
11762
11540
Agricultural
2679
3348
3302
3231
3606
4428
2958
3932
4150
2237
2524
2053
Industrial
24424
23543
23128
21281
25271
30622
23932
30218
26387
22473
18916
21477
CONSUMER
GOODS
42437
36173
38839
37889
40826
35082
36865
34116
33458
33229
38567
35164
Consumer Durables
17278
15635
15296
16009
16958
15890
15913
15292
14457
16882
17166
15126
Consumer Non-durables
25159
20538
23543
21880
23868
19192
20952
18824
19001
16347
21401
20038
MISCELLANEOUS
643
482
969
953
935
1327
1084
481
730
794
505
1396
TOTAL
IMPORTS
114302
102643
115212
115284
122462
116571
117409
110686
105584
101901
99653
111827
1973/74 I
II
III
IV
1974/75 I
II
III
IV
19751/76 I
II
III
IV
RAW
MATTERIALS
4825
7101
5098
5266
8191
9180
4552
17317
6003
4748
9774
5211
SEMI-FINISHED
GOODS
27936
27189
29440
30480
38014
34323
44696
30264
38377
27298
30263
33919
FEULS
5732
18976
3845
27007
32893
22492
47192
18531
11777
64469
35807
5260
CAPITAL
GOODS
33770
33193
31319
22897
23931
20708
24908
22402
16402
26515
35272
89132
Transport
11953
10143
12221
10972
13991
9167
15202
13380
10553
18876
14631
62253
Agricultural
2045
2178
2085
2642
3346
5921
3278
1849
1289
1948
2324
2613
Industrial
19772
20872
17013
9283
6594
5620
6428
7173
4560
5691
18317
24266
CONSUMER
GOODS
38645
36607
41314
53488
67790
62660
60833
58153
55793
64193
56507
56179
Consumer Durables
17409
17680
17786
19738
25960
24629
22054
24650
21490
27912
19680
19959
Consumer Non-durables
21236
18927
23528
33750
41830
38031
38779
33503
34303
36281
36827
36220
MISCELLANEOUS
945
830
1017
1184
1090
1077
2037
452
973
204
191
511
TOTAL
IMPORTS
111853
123896
112033
140322
171909
150440
184218
147119
129325
187427
167814
190212
1976/77 I
II
III
IV
1977/78 I
II
III
IV
1978/79 I
II
III
IV
RAW
MATTERIALS
4461
4760
10225
7626
10070
7346
4772
8658
12259
15132
10640
12764
SEMI-FINISHED
GOODS
36350
31975
28763
26929
26483
30151
23891
20985
76828
51911
39774
68084
FEULS
39271
30759
34050
3987
1476
548
479
813
2420
3511
41288
48021
CAPITAL
GOODS
35425
57911
78461
39524
38920
64485
71526
62175
125531
101733
96626
85498
Transport
14618
21928
40874
9936
13700
16925
23752
28573
58309
41136
36886
27007
Agricultural
1871
2524
4827
3030
1501
5177
2314
3586
1467
3108
8291
4159
Industrial
18936
33459
32760
26558
23719
42383
45460
30016
65755
57489
51449
54332
CONSUMER
GOODS
54020
68321
66766
66345
46396
98793
73865
55727
111431
94682
87641
79883
Consumer Durables
21173
23603
22048
18773
12548
24013
21536
19912
38737
20853
37010
26212
Consumer Non-durables
32847
44718
47572
39630
33848
74780
52329
35815
72694
73829
50631
53671
MISCELLANEOUS
2035
6214
4122
12622
9873
15054
332
197
13660
1494
518
2810
TOTAL
IMPORTS
171562
199940
222387
157033
133218
216377
174865
148555
342129
268463
276487
297060
1979/80 I
II
III
IV
1980/81 I
II
III
IV
1981/82 I
II
III
IV
RAW
MATTERIALS
12589
10621
13973
16409
7910
14622
10180
20969
12867
11569
10269
21919
SEMI-FINISHED
GOODS
57198
41382
78422
84547
65997
41026
44569
32674
69499
35739
45396
72074
FEULS
53952
76245
79902
102115
85655
101861
84396
70814
91046
107977
94444
68155
CAPITAL
GOODS
135823
75286
100206
105932
94789
113027
138947
102941
163623
148630
138510
105777
Transport
57503
26506
20064
23389
34290
48350
47912
65486
90775
78666
41962
34904
Agricultural
7846
5585
21140
29386
5800
8553
11874
718
8786
6179
9989
3388
Industrial
70474
43195
59002
53157
54699
56124
79161
36737
64062
63785
86559
67485
CONSUMER
GOODS
79328
52673
89707
76331
95096
95021
82524
67387
123043
105170
103834
114536
Consumer Durables
24653
20934
27059
29188
38742
24160
26244
18932
54077
29231
43855
34954
Consumer Non-durables
54675
31739
62648
47143
56354
70861
56280
48455
68966
75939
59979
79582
MISCELLANEOUS
645
8649
7097
14141
155
10672
5
37
467
925
227
668
TOTAL
IMPORTS
339535
264856
369307
399475
349602
376229
360621
294822
460545
410010
392680
383129
1982/83 I
II
III
IV
1983/84 I
II
III
IV
1984/85 I
II
III
IV
RAW
MATTERIALS
10765
16622
17488
15322
26755
14768
12558
18747
10570
14136
11401
13543
SEMI-FINISHED
GOODS
57927
46735
62112
83432
51803
51191
70869
68338
53480
86150
43078
57744
FEULS
120548
116635
91031
68781
94789
96860
92505
95525
59813
84818
66155
79309
CAPITAL
GOODS
138540
154409
133045
150598
169899
176627
129952
453716
85241
107402
135163
149817
Transport
48758
37823
40520
41122
37509
102542
45838
276142
39529
35296
48666
62669
Agricultural
2682
4609
5271
23507
4364
40878
3185
4394
6183
4604
7180
24732
Industrial
87100
111977
87254
85969
128026
33207
80929
173180
39529
67502
79317
62416
CONSUMER
GOODS
106500
82845
125356
148551
117119
106867
89049
120821
105106
121901
165077
252092
Consumer Durables
35818
28494
28186
43750
24005
30059
27565
30576
27506
34272
29749
41785
Consumer Non-durables
70682
54351
97170
104801
93114
76808
61484
90245
77600
87629
135328
210307
MISCELLANEOUS
482
17
449
17
57
5902
1831
507
1083
802
171
114
TOTAL
IMPORTS
434762
417263
429481
466701
460422
452215
396764
757654
315293
415209
421045
552619
1985/86 I
II
III
IV
1986/87 I
II
III
IV
1987/88 I
II
III
IV
RAW
MATTERIALS
16457
33503
17611
15756
12586
9814
20104
6975
12614
14746
16384
15227
SEMI-FINISHED
GOODS
45238
60233
68426
84349
83833
55055
63440
67573
75150
117736
69121
45953
FEULS
58291
99093
58758
36430
65433
51807
50516
58113
59528
50870
64697
41519
CAPITAL
GOODS
160326
182345
194964
208740
240182
215954
196555
214013
211946
355013
315872
198604
Transport
65606
77546
72670
84087
95962
95587
10102
78634
72022
207635
105985
98354
Agricultural
14421
12546
17824
30199
16369
7346
8561
4854
19918
17719
13460
6339
Industrial
80299
92253
104470
94454
127851
113021
177892
130525
120006
129659
196427
93911
CONSUMER
GOODS
198978
224975
210967
234975
268161
147561
201789
112010
148003
142130
130714
174532
Consumer Durables
33401
36907
38542
29328
45611
42540
49926
34097
54720
44435
43489
46408
Consumer Non-durables
165577
188068
172425
205647
222550
105021
151863
77913
93283
97695
87225
128124
MISCELLANEOUS
2139
711
1275
174
224
1248
1812
1188
5684
1255
828
547
TOTAL
IMPORTS
481429
600860
552001
580424
670419
481439
534216
459872
512925
681750
597616
476382
1988/89 I
II
III
IV
1989/90 I
II
III
IV
1990/91 I
II
III
IV
RAW
MATTERIALS
13692
14494
12904
13434
16320
15433
14938
11134
38902
10870
6530
610
SEMI-FINISHED
GOODS
92852
59902
112373
91646
116532
67602
60483
71019
85539
45780
96460
9450
FEULS
47789
67215
48757
58701
55701
55467
68489
42003
93873
60780
26430
29350
CAPITAL
GOODS
315784
194182
156877
155745
194431
205830
150465
146984
239174
362030
321920
44610
Transport
190567
70989
49196
43746
32009
44439
34764
36802
62937
156210
216880
17400
Agricultural
1690
2853
3454
5906
4820
7421
2280
3110
3481
8060
6050
450
Industrial
123527
120340
104227
106093
157602
153970
113421
107072
172756
197760
98990
26760
CONSUMER
GOODS
140641
218785
165401
123991
123412
154602
108865
124150
278008
215240
117370
31910
Consumer Durables
39788
53009
50854
56445
52620
47140
50091
68312
78360
65230
52570
16330
Consumer Non-durables
100853
165776
114547
67546
70792
107462
58774
55838
199648
150010
64800
15580
MISCELLANEOUS
1507
898
1098
1681
2379
25241
94
354
6203
3940
8270
620
TOTAL
IMPORTS
612265
555476
497410
445198
508775
524175
403334
395644
741699
698640
576980
116550
1991/92 I
II
III
IV
1992/93 I
II
III
IV
1993/94 I
II
III
IV
RAW
MATTERIALS
2336
3513
3551
2418
12548
11255
20072
27061
7293
25730
27951
25526
SEMI-FINISHED
GOODS
18824
35969
24146
47957
44347
72159
91961
118014
156091
234564
156674
224971
FEULS
33458
14678
36232
108854
171667
163703
208712
276703
164780
253270
153902
153648
CAPITAL
GOODS
40747
187972
224102
111285
110657
724508
212330
217957
259961
347903
326534
451102
Transport
18214
145501
167587
48057
47943
622368
78461
93402
129346
144246
151074
211834
Agricultural
569
1059
800
919
1989
3180
1812
2453
2507
6357
17030
7806
Industrial
21964
41412
55715
62309
60725
98960
132057
122102
128108
197300
158430
231462
CONSUMER
GOODS
53842
70529
78173
93200
121540
438089
293431
279851
304746
427807
387900
544347
Consumer Durables
24050
30476
30448
35187
49556
68045
74000
70626
101306
129387
105331
126676
Consumer Non-durables
29792
40053
47725
58013
71984
370044
219431
209225
203440
298420
282569
417671
MISCELLANEOUS
52
38
369652
249383
232
704
984
236
6189
1061
96020
2430
TOTAL
IMPORTS
149259
312699
735856
613097
460991
1410418
827490
919822
899060
1290335
1148981
1402024
1994/95 I
II
III
IV
1995/96 I
II
III
IV
1996/97 I
II
III
IV
RAW
MATTERIALS
8569
50000
31630
40660
66620
43570
45858
23714
39951
58340
35411
39948
SEMI-FINISHED
GOODS
194996
199417
275783
442470
363820
209700
402588
286250
374847
541690
365464
347678
Chemicals
45423
50761
42992
76350
75510
83250
61613
64983
76078
75069
44633
72205
Fertilizers
10217
34.19
62005
188130
42530
2710
56398
62059
0
137620
40739
150.58
Textile Materials
24895
33502
27273
23200
47940
33100
19668
18074
33153
37618
44717
41718
Others
114461
115120
143513
154780
197830
90650
264910
141134
265616
291384
235375
233604
FEULS
305603
273719
199611
214400
275320
91140
120975
447112
164726
28792
33533
220392
Crude Petroleum
127391
149793
154227
91140
120320
56400
0
0
0
0
516.05
76370
Petroleum Products
178200
123839
45382
123140
154620
34710
112516
184669
133787
16265
32945
123121
Others
12
87
1
120
470
30
8459.6
262443
30939
12527
71.49
20901
CAPITAL
GOODS
433283
487117
478953
686620
639590
665980
766535
523394
668716
709318
823409
1E+06
Transport
163926
244704
214580
253320
310990
279080
392361
261009
312195
249935
400027
417664
Tyres for heavy vehicles
15396
57335
26640
23510
43200
38230
45726
32803
60274
63171
63811
45626
Heavy road motor vehicles
143216
186475
187034
225250
265570
234590
342232
222266
157959
182710
227351
221375
Aircraft
5259
879
772
2430
1630
400
4145.9
5177.3
92107
3440.2
108671
149669
Others
55
15
134
2120
590
5860
257.11
762.32
1855.5
614.21
194.24
994.39
Agricultural
40522
13976
6276
66520
18950
14900
23542
20046
13362
27042
24322
20440
Industrial
228835
228437
258097
366790
309650
372000
350631
242340
343159
432342
399060
663727
CONSUMER
GOODS
606552
513664
403595
601470
804490
762400
458946
413015
420858
410383
500878
422175
Consumer Durables
111083
135673
147195
174430
177610
176040
206315
159571
185336
199364
240998
202374
Radio & Television
11848
11686
16988
20160
14740
12590
16583
31949
18812
15537
0
0
Tyres, cars, and other vehicles
7935
5081
6253
7060
7410
13700
15333
10551
18041
14534
14661
8542.8
Cars and other vehicles
41719
53628
67003
76460
79210
79210
96080
50434
62587
81215
75032
73358
Others
49581
65278
56951
70750
76250
70550
78319
66637
85897
88078
151304
120473
Consumer Non-durables
495469
377991
256400
427040
626880
586360
252631
253444
235522
211020
259880
219802
Cereals
340021
204952
68986
239620
36630
395440
34761
87208
3257.8
3989.4
2899.1
5005.9
Other Food
54630
57752
38417
70860
10530
23540
41958
19624
27501
22655
23826
18600
Medical and pharmaceutical
34221
54693
77434
40460
29210
51610
49983
35231
40859
39049
37123
39621
Textile Fabrics
25240
27492
37292
36310
503600
60030
74772
59515
61728
75822
97210
69814
Others
41357
33102
34271
39800
46920
65740
51157
51866
102177
69504
98821
86760
MISCELLANEOUS
33529
1582
41688
21360
1350
6460
4210
132242
10234
56777
14779
75.97
TOTAL
IMPORTS
1582532
1525499
1431260
2006980
2151190
1779250
1799112
1825727
1679332
1805300
1773472
2132100
1997/98 I
II
III
IV
1998/99 I
II
III
IV
RAW
MATTERIALS
44270.995
46351.928
54538.367
46130.117
24096.452
56136.997
56200
67500
SEMI-FINISHED
GOODS
388236.4
348302.84
338782.29
451782.59
530189.87
509500
520700
405800
Chemicals
74522.598
50280.118
46662.394
76741.315
61487.505
86859.483
99500
101100
Fertilizers
0
201.655
21753.074
29214.928
162311.95
53548.704
90708.029
70822.005
Textile Materials
31634.144
31330.194
31133.482
41219.415
30863.241
25931.928
30300
33800
Others
282079.65
266490.88
239233.34
304606.93
275527.17
343159.89
300200
200000
FEULS
341869.75
168768.22
1429842.4
342350.09
555953.76
233417.5
357900
182600
Crude Petroleum
173.04
120.505
165819.65
355.34069
2.425
2278.9821
0
0
Petroleum Products
341079.58
168408.68
1263724.9
341123.81
525799.63
226405.28
356600
180800
Others
617.125
239.029
297.89004
870.93575
30151.703
4733.2374
1300
1800
CAPITAL
GOODS
655913.34
693607.35
719316.42
711679.26
738281.6
904683.98
1167700
1134300
Transport
203390.59
153224.27
179292.32
134589.87
171888.19
244818.66
325200
417600
Tyres for heavy vehicles
44161.584
45378.733
55986.421
41667.938
40116.559
65732.15
56400
59800
Heavy road motor vehicles
159011.04
105909.95
122162.54
91821.486
95513.983
172230.04
266600
351900
Aircraft
93.92702
1275.162
70.37403
347.57678
4101.4577
5932.5511
1300
5300
Others
124.03618
660.42215
1072.9838
752.8712
32156.191
923.91298
900
700
Agricultural
20402.821
14773.17
16189.162
15384.375
21444.98
38028.122
25300
26800
Industrial
432119.93
525609.91
523834.94
561705.02
544948.43
621837.2
817200
689800
CONSUMER
GOODS
477305
412134.43
479464.67
470466.33
705039.71
988570.47
847900
746900
Consumer Durables
206337.69
183851.76
211250.42
183225.98
257078.49
311447.65
300600
281400
Radio & Television
0
0
0
0
0
0
41900
32200
Tires, cars, and other vehicles
8247.3058
9488.1441
8928.9443
6873.9111
8909.6476
11530.365
10500
7892.705
Cars and other vehicles
79560.145
58504.457
87832.718
66842.564
88346.794
88997.486
96100
129100
Others
118530.24
115859.16
114488.76
109509.5
159822.04
210919.8
152100
112200
Consumer Non-durables
270967.31
228282.67
268214.25
287240.35
447961.23
677122.82
547300
465500
Cereals
4742.0062
15455.038
3804.1199
29649.375
132685.11
220242.58
70700
69100
Other Food
31671.027
26830.653
36212.439
42219.624
51266.371
80894.171
71900
57300
Medical and pharmaceutical
37038.631
32392.686
46585.911
41269.412
51432.286
94706.89
118900
95900
Textile Fabrics
80204.62
72530.63
116781.41
90790.968
121927.45
139734.86
179500
131700
Others
117311.02
81073.66
64830.373
83310.972
90650.007
141544.31
106300
111700
MISCELLANEOUS
6599.511
1614.7014
10060.592
8565.3672
220940.64
262119.98
283400
202200
TOTAL
IMPORTS
1914195
1670779.5
3032004.8
2030973.7
2774502
2954428.9
3233800
2739300
1999/00 I
II
III
IV
2000/01 I
II
III
IV
RAW MATTERIALS
41560.951
54340
32956
32200
43695.76
36072.667
59911.752
59386.626
SEMI-FINISHED
GOODS
468828.58
414077
410601
375314
476420.43
392432.29
456003.8
645028.48
Chemicals
93944.027
85149
78278
93860
91505.141
86489.886
109896.38
131491.41
Fertilizers
138135.95
82305
73335
42354
112912.51
234.9954
7215.1962
6491.5328
Textile Materials
22050.096
34487
16446
20800
22289.993
34879.887
24857.018
28220.541
Others
214698.51
212136
242542
218300
249712.78
270827.52
314035.2
478825
FEULS
571165.2
260604
363330
841506
451186.15
427894.76
496012.75
805646.56
Crude Petroleum
552.10418
30
30
6
0
0
0
0
Petroleum Products
568672.47
258252
362101
839000
450709.4
425558.58
495733.77
802193.63
Others
1940.6199
2322
1199
2500
476.749
2336.1822
278.98422
3452.929
CAPITAL
GOODS
1262667
943408
899656
725600
860125.73
797452.26
1063212.5
984129.11
Transport
358219.67
336660
233357
212800
309457.66
277388.05
374266.34
317384.58
Tires for heavy vehicles
49720.863
45825
43330
49700
49575.247
56511.911
59640.727
66956.291
Heavy road motor vehicles
306410.61
282997
189310
160800
257632.25
214826.3
239552.21
223755.24
Aircraft
952.84038
2136
151
700
1550.617
5209.1839
73985.49
24286.759
Others
1135.355
5702
566
1600
699.542
840.65749
1087.9081
2386.295
Agricultural
27169.422
21295
21624
15300
21440.695
17951.007
17046.64
10725.319
Industrial
877277.86
585453
644675
497500
529227.38
502113.2
671899.54
656019.21
CONSUMER
GOODS
934555.13
1197715
705142
631200
710501.08
897772.26
1148051.8
1141195.7
Consumer Durables
280864.18
357267
251797
210800
222760.04
309968.42
390778.37
345121.69
Radio & Television
40908.699
32215
30070
22600
27583.139
42024.314
56807.203
49427.018
Tires, cars, and other vehicles
4832.042
6819
5732
7900
7661.095
9939.1207
15430.245
15952.386
Cars and other vehicles
110320.25
209610
107327
94500
91453.404
122814.43
138552.26
126821.84
Others
124803.18
108623
108668
85800
96062.406
135190.55
179988.66
152920.44
Consumer Non-durables
653690.96
840448
453345
420400
487741.04
587803.84
757273.39
796074.01
Cereals
188765.01
388572
67715
53100
37221.725
104665.65
198622.41
307463.86
Other Food
41950.657
47895
48996
111000
47435.081
64105.787
79609.793
75683.944
Medical and pharmaceutical
97676.764
97840
41097
41700
77631.347
104180.4
104080.75
82942.022
Textile Fabrics
147151.87
164872
161484
116100
135449.88
168837.93
207867.88
162037.05
Others
178146.66
141269
134053
98500
190003
146014.08
167092.56
167947.14
MISCELLANEOUS
102363.96
49138
56300
64160
58398.616
78356.823
123889.47
101138.63
TOTAL
IMPORTS
3381140.8
2919282
2467985
2669980
2600327.8
2629981
3347082
3736525.1
2001/02 I
II
III
IV
2002/03 I
II
III
RAW
MATTERIALS
75578.059
60976
53557
63960.334
41218.216
32781.31
56048.64
SEMI-FINISHED
GOODS
686755
756174
438554
580989.11
765694.02
560809
493845.2
Chemicals
114731
90852
72815
79745.696
75214.131
76371.47
85388.64
Fertilizers
197943
166175
38043
157847.67
207697.12
162999.4
80484.52
Textile Materials
14592
16523
5907
30424.396
21686.008
27085.34
26217.9
Others
359489
482624
321789
312982.23
461096.75
294352.8
301754.1
FEULS
467944
914200
139140
765405.76
234673.11
656538
745074.8
Crude Petroleum
0
0
0
6.87135
0.105
0
Petroleum Products
467944
913642
135505
764327.75
233677.52
655872
744159
Others
0
558
3635
1071.1236
995.484
665.9669
915.8449
CAPITAL
GOODS
1029659
1089587
1101557.6
880715.51
1038948.7
1068901
1267921
Transport
310390
304579
300323
279571.36
326533.08
290685.1
448233.9
Tires for heavy vehicles
67696
54743
37881
46388.371
61274.391
56675.22
53808.13
Heavy road motor vehicles
206230
210545
240454
227996.83
255940.18
205888.8
326272.6
Aircraft
35484
36663
20239
4614.0513
8174.0062
26709.18
65554.8
Others
980
2628
1749
572.10744
1144.5052
1411.848
2598.382
Agricultural
17104
14163
13229.6
14884.092
9800.0266
14762.76
12768.29
Industrial
702165
770845
788005
586260.06
702615.58
763453
806918.8
CONSUMER
GOODS
1362178
1644484
1142883
865692.04
1220421.1
1428266
1057054
Consumer Durables
366010
335444
330559
275940.64
382344.62
422774.5
351766.6
Radio & Television
49442
40213
64412
43559.796
63454.891
39483.17
61051.5
Tires, cars, and other vehicles
12823
10535
7399
8197.169
10752.729
13188.22
16291.92
Cars and other vehicles
129984
132507
134732
111959.28
150887.42
151377.2
125032
Others
173761
152189
124016
112224.39
157249.58
218725.9
149391.2
Consumer Non-durables
996168
1309040
812324
589751.4
838076.46
1005491
705287.4
Cereals
346688
632036
212742
133994.91
292313.45
373044.7
147633.2
Other Food
128880
159571
106116
60300.028
89286.855
91078.29
81303.7
Medical and pharmaceutical
106807
120886
116035
77592.802
85305.844
116473.1
90421.42
Textile Fabrics
175075
226232
209962
205973.1
210271.91
220153.5
271391.9
Others
238718
170315
167469
111890.56
160898.41
204741.6
114537.2
MISCELLANEOUS
65749
109721
100606
89223.797
140291.32
581610.2
445982.1
TOTAL
IMPORTS
3687863.1
4575142
2976297.6
3245986.6
3441246.4
4328905
4065926
Annex
C: Value OF COFFEE and TOTAL EXPORTS (Thousands of Birr):1979/80: I-2002/03:
III
Period
1979/80 I
II
III
IV
1980/81 I
II
III
IV
1981/82 I
II
III
IV
Export
229150
199940
242620
277324
203823
154983
199340
281605
161768
149551
203440
281069
Coffee
162442
104661
172545
192003
143459
55642
122957
202267
101265
43372
141491
194087
Non-coffee
66708
95279
70075
85321
60364
99341
76383
79338
60503
106179
61949
86982
Import
339535
264856
369307
399475
349602
376229
360621
294822
460545
410010
392680
383129
Exchange
Rate
2.07
2.07
2.07
2.07
2.07
2.07
2.07
2.07
2.07
2.07
2.07
2.07
Adjusted Values
Export
229150
199940
242620
277324
203823
154983
199340
281605
161768
149551
203440
281069
Coffee
162442
104661
172545
192003
143459
55642
122957
202267
101265
43372
141491
194087
Non-coffee
66708
95279
70075
85321
60364
99341
76383
79338
60503
106179
61949
86982
Import
339535
264856
369307
399475
349602
376229
360621
294822
460545
410010
392680
383129
Continued
Period
1982/83 I
II
III
IV
1983/84 I
II
III
IV
1984/85 I
II
III
IV
Export
186418
165368
211356
246909
210597
163932
253779
302213
218735
88843
174775
261281
Coffee
105745
73199
142047
175088
122675
80125
177750
209894
13834
19757
112832
195337
Non-coffee
80673
92169
69309
71821
87922
83807
76029
92319
204901
69086
61943
65944
Import
434762
417263
429481
466701
460422
452215
396764
757654
315293
415209
421045
552619
Exchange
Rate
2.07
2.07
2.07
2.07
2.07
2.07
2.07
2.07
2.07
2.07
2.07
2.07
Adjusted Values
Export
186418
165368
211356
246909
210597
163932
253779
302213
218735
88843
174775
261281
Coffee
105745
73199
142047
175088
122675
80125
177750
209894
13834
19757
112832
195337
Non-coffee
80673
92169
69309
71821
87922
83807
76029
92319
204901
69086
61943
65944
Import
434762
417263
429481
466701
460422
452215
396764
757654
315293
415209
421045
552619
Continued
Period
1985/86 I
II
III
IV
1986/87 I
II
III
IV
1987/88 I
II
III
IV
Export
165795
88198
306629
363794
234276
83040
210512
267456
160791
97090
215007
300754
Coffee
111105
13411
246313
293961
188370
30622
134485
170871
77696
31061
137404
193020
Non-coffee
54690
74787
60316
69833
45906
52418
76027
96585
83095
66029
77603
107734
Import
481429
600860
552001
580424
670419
481439
534216
459872
512925
681750
597616
476382
Exchange
Rate
2.07
2.07
2.07
2.07
2.07
2.07
2.07
2.07
2.07
2.07
2.07
2.07
Adjusted Values
Export
165795
88198
306629
363794
234276
83040
210512
267456
160791
97090
215007
300754
Coffee
111105
13411
246313
293961
188370
30622
134485
170871
77696
31061
137404
193020
Non-coffee
54690
74787
60316
69833
45906
52418
76027
96585
83095
66029
77603
107734
Import
481429
600860
552001
580424
670419
481439
534216
459872
512925
681750
597616
476382
Continued
Period
1988/89 I
II
III
IV
1989/90 I
II
III
IV
1990/91 I
II
III
IV
Export
256314
99358
228722
318359
187540
180111
174465
194690
139546
98729
128172
176038
Coffee
192734
37605
164359
231750
103371
108564
80281
112887
50854
27299
79517
110781
Non-coffee
63580
61753
64363
86609
84169
71547
94184
81803
88692
71430
48655
65257
Import
612265
555476
497410
445198
508775
524175
403334
395644
741699
698640
576980
116550
Exchange
Rate
2.07
2.07
2.07
2.07
2.07
2.07
2.07
2.07
2.07
2.07
2.07
2.07
Adjusted Values
Export
256314
99358
228722
318359
187540
180111
174465
194690
139546
98729
128172
176038
Coffee
192734
37605
164359
231750
103371
108564
80281
112887
50854
27299
79517
110781
Non-coffee
63580
61753
64363
86609
84169
71547
94184
81803
88692
71430
48655
65257
Import
612265
555476
497410
445198
508775
524175
403334
395644
741699
698640
576980
116550
Continued
Period
1991/92 I
II
III
IV
1992/93 I
II
III
IV
1993/94 I
II
III
IV
Export
49435
36787
81511
111293
89053
168537
235276
307948
205661
245275
271844
515949
Coffee
27139
23163
51804
66218
63756
83650
155373
234203
142307
100146
133043
342523
Non-coffee
22296
13624
29707
45075
25297
84887
79903
73745
63354
145129
138801
173426
Import
149259
312699
735856
613097
460991
1410418
827490
919822
899060
1290335
1148981
1402024
Exchange
Rate
2.07
2.07
2.07
2.07
2.07
2.07
2.07
5.0091
5.472667
5.468367
5.913433
6.243233
Adjusted Values
Export
49435
36787
81511
111293
89053
168537
235276
127258.9
77789.91
92846.6
95159.11
171067.5
Coffee
27139
23163
51804
66218
63756
83650
155373
96783.9
53826.68
37909.35
46571.76
113566.6
Non-coffee
22296
13624
29707
45075
25297
84887
79903
30474.97
23963.23
54937.25
48587.35
57500.95
Import
149259
312699
735856
613097
460991
1410418
827490
380114.5
340063.5
488444.5
402201.3
464853.6
Continued
Period
1994/95 I
II
III
IV
1995/96 I
II
III
IV
1996/97 I
II
III
IV
Export
549695
725458
468184
988708.6
691823
454241.8
548748.7
844242.4
684464.4
573104.1
860782.4
1367275
Coffee
394156
475808
215851
713218.7
491228.2
279739
335157.1
617883.8
537983.9
227354.5
529877.1
1012178
Non-coffee
155539
249650
252333
275489.9
200594.8
174502.8
213591.7
226358.6
146480.5
345749.6
330905.3
355096.9
Import
1582532
1525499
1431260
2006980
2151190
1779250
1799112
1825727
1679332
1805300
1773472
2132100
Exchange
Rate
6.197233
6.2732
6.2594
6.272167
6.304967
6.303167
6.337367
6.325633
6.3455
6.3974
6.580133
6.679633
Adjusted Values
Export
183609.1
239383.1
154829.7
326303
227134.2
149175.9
179240
276269.8
223282.9
185438.7
270787.8
423714.7
Coffee
131656
157004.8
71382.49
235383.2
161276.4
91868.08
109473.7
202196.3
175498.6
73564.87
166690.5
313671.2
Non-coffee
51953.14
82378.29
83447.19
90919.8
65857.79
57307.82
69766.31
74073.58
47784.21
111873.8
104097.3
110043.6
Import
528597.4
503376.7
473321.4
662362.6
706262.8
584317
587651.5
597451
547823.9
584138.9
557904.8
660732
Continued
Period
1997/98 I
II
III
IV
1998/99 I
II
III
IV
1999/00 I
II
III
IV
Export
758766.7
967259.9
1047257
1368298
918157.7
632275
794220.9
1225232
919959.6
771639.4
1041299
1224904
Coffee
489949.9
535041.7
789496.4
1075043
529797.3
308750.6
464935
809229.8
540248.2
317390.5
599129.6
676877.2
Non-coffee
268816.8
432218.2
257760.9
293255.3
388360.4
323524.4
329285.8
416001.8
379711.4
454248.8
442169.6
548026.6
Import
1914195
1670779
3032005
2030974
2774502
2954429
3233800
2739300
3381141
2919282
2467985
2669980
Exchange
Rate
6.770967
6.816433
6.909367
7.03
7.152867
7.371082
7.592482
7.928
8.1196
8.126833
8.1489
8.197233
Adjusted Values
Export
231967.9
293735.4
313751.3
402898.5
265709.8
177560
216534.9
319907.9
234533.3
196545.6
264512.9
309317.9
Coffee
149786
162480.3
236527.8
316548.8
153320.4
86705.54
126759
211289.8
137730.2
80843.1
152192.1
170927.9
Non-coffee
82181.87
131255.1
77223.44
86349.7
112389.3
90854.44
89775.87
108618
96803.11
115702.5
112320.8
138390
Import
585202.1
507378.8
908368.3
598025
802925.5
829683.8
881657.2
715231
861983.5
743575.4
626922.5
674234.6
Continued
Period
2000/01 I
II
III
IV
2001/02 I
II
III
IV
2002/03 I
II
III
Export
1040091
684368.7
1026398
1115747
807109.2
900759.2
916991.2
1239460
960279.8
997743.9
1072448
Coffee
552910.2
269206.9
256063.7
441919.8
293402.7
234482.7
338319.1
527604.8
281873.3
222200.7
360520.2
Non-coffee
487181.1
415161.8
770334.7
673827.5
513706.6
666276.5
578672.1
711855.6
678406.5
775543.2
711927.8
Import
2600328
2629981
3347082
3736525
3687863
4575142
2976298
3245987
3721114
4328905
4065926
Exchange
Rate
8.239267
8.283633
8.357467
8.431133
8.492714
8.5525
8.5605
8.5643
8.5693
8.5768
8.5845
Adjusted Values
Export
261308.3
171017.1
254221.1
273936.7
196723.5
218014.8
221736.1
299578.8
231965.2
240804.3
258601.8
Coffee
138910.9
67272.22
63422.56
108499.5
71513.48
56752.9
81808.37
127522.6
68089.31
53627.86
86933.04
Non-coffee
122397.4
103744.9
190798.6
165437.2
125210
161261.9
139927.7
172056.2
163875.9
187176.4
171668.8
Import
653295.8
657206.9
829014.4
917386.4
898873.6
1107342
719693.5
784558.2
898872.2
1044776
980425.9
Appendix
D: Domestic Credit and Foreign Assets: 1991/92: I-2002/03:III
Period
Domestic
Credit
Claims on
Central Government, Net
Claims on
Non-Central Government, Net
Net
Foreign Assets
1991/92:I
9285.9
6361.2
2924.7
274.5
II
9458.9
6459.6
2999.3
319.3
III
9851.1
6756.7
3094.4
345.5
IV
10105.9
7033.6
3072.3
403
1992/93:I
10364.6
7320.2
3044.4
396.5
II
10911.8
7507.9
3403.9
1024.3
III
11906.8
7819.4
4087.4
894.7
IV
12166.8
7824.9
4341.9
809.6
1993/94:I
12310.9
7871
4439.9
2187.1
II
11493.4
6733.6
4759.8
2741.2
III
11729.9
8381.3
3348.6
3012.7
IV
12744.2
9616.1
3128.1
3764.6
1994/95: I
12665.4
9222
3443.4
3918.9
II
12476.8
8681.4
3795.4
4546.9
III
13192.6
8494.3
4698.3
4610
IV
13873.4
9024.1
4849.3
4658.6
1995/96:I
14178
8626
5552
4956.3
II
14422.3
8282.6
6139.7
4357.8
III
14705.3
7791.2
6914.1
2949.3
IV
15193.6
7869.9
7323.7
3542.4
1996/97:I
16468.1
8882
7586.1
5467.2
II
16181.1
7781.8
8399.3
4599.2
III
16891.2
7639
9252.2
4189.5
IV
16435.1
7925.5
8509.6
5204.4
1997/98:I
16601.4
8114.6
8486.8
5144.3
II
17541.4
8219.7
9321.7
5049.9
III
16915.4
6977.6
9937.8
5776.4
IV
18505.7
8840.2
9665.5
5434.7
1998/99:I
18456.6
8961.4
9495.2
5559.8
II
18936.3
8877.5
10058.8
5526.2
III
19540.9
8876.1
10664.8
5819.5
IV
19994.7
9567.6
10427.1
Period
Domestic
Credit
Claims on
Central Government, Net
Claims on
Non-Central Government, Net
Net
Foreign Assets
1999/00:I
22036.7
11465
10571.7
5788.2
II
23820
12133
11687
5016.3
III
25216.7
13240.6
11976.1
4395.1
IV
27072.2
15574
11498.2
4428.5
2000/01:I
27266.269
16046.91
11219.36
5016.856
II
27578.131
15638.164
11939.97
4639.472
III
27167.277
15191.258
11976.02
4615.952
IV
27551.654
15171.041
12380.61
4799.953
2001/02:I
27484.441
15436.412
12048.03
5792.308
II
26949.943
14666.911
12283.03
5994.174
III
27118.698
15089.874
12028.82
6308.911
IV
27528.812
15985.1
11543.71
7822.468
2002/03:I
27419.127
16400.542
11018.59
8785.127
II
26453.039
15030.997
11422.04
10447.38
III
26765.3
15164.1
11601.2
10743.7
Appendix
E: Electricity Energy Production: 1973/74:I-2002/03:III
Period
Hydro
Power
Thermal
Power
Geothermal
Total (KWH)
1973/74 I
89311
7494
96805
II
86279
8121
94400
III
86751
8866
95617
IV
81845
8437
90282
1974/75 I
91309
8502
99811
II
87933
9015
96948
III
85403
9409
94812
IV
83183
9041
92224
1975/76 I
92882
7949
100831
II
87091
8724
95815
III
86814
9972
96786
IV
89933
9398
99331
1976/77 I
94526
9575
104101
II
91713
10695
102408
III
91894
11376
103270
IV
91798
10662
102460
1977/78 I
96068
10995
107063
II
95050
10452
105502
III
95958
11500
107458
IV
98264
11226
109490
1978/79 I
108731
10343
119074
II
102506
11629
114135
III
102856
11635
114491
IV
106874
11806
118680
1979/80 I
122553
15791
138344
II
118056
11464
129520
III
120250
13257
133507
IV
121362
13405
134767
1980/81 I
125559
19876
145435
II
116525
20512
137037
III
121994
18331
140325
IV
124737
14171
138908
1981/82 I
122886
122886
II
130502
130502
III
140500
140500
IV
140103
140103
1982/83 I
145165
145165
II
147139
12578
159717
III
153545.1
11781
1635.4
166961.5
IV
149094
13755
162849
1983/84 I
163566
14768
178334
II
163457
13619
177076
III
163965.3
13288.9
12988.9
190243.1
IV
166064.4
15696.9
15696.9
197458.2
Period
Hydro
Power
Thermal
Power
Geothermal
Total (KWH)
1984/85 I
191323.9
17840
209163.9
II
171438
11520
182958
III
184484.6
1320.4
185805
IV
180969.7
12678.3
193648
1985/86 I
202095
11755.3
213850.3
II
206116.8
11431.8
217548.6
III
210658.5
10229.2
220887.7
IV
209921.7
11707.1
221628.8
1986/87 I
215618.3
13678.2
229296.5
II
225101.1
11127.6
236228.7
III
224545.8
11816.9
236362.7
IV
218674.8
12070.4
230745.2
1987/88 I
233529.4
15241.4
248770.8
II
229009.4
10547.7
239557.1
III
243892.6
10494.5
254387.1
IV
242505
10083
252588
1988/89 I
256323
15741
272064
II
245778.6
10339.3
256117.9
III
245042.5
7727.8
252770.3
IV
256827
11098.5
267925.5
1989/90 I
273511.5
82317
355828.5
II
268392.4
6202.1
274594.5
III
272665.7
7317.1
279982.8
IV
273355.7
8160.1
281515.8
1990/91 I
287617.6
12715.3
300332.9
II
278183.6
7947.8
286131.4
III
280566.5
6200
286766.5
IV
251210.1
4371.1
255581.2
1991/92 I
293558.3
2859.9
296418.2
II
278845.2
4699.3
283544.5
III
252152.1
6535.3
258687.4
IV
272258.4
5838.2
278096.6
1992/93 I
304540.7
6111.8
310652.5
II
304548
5804.2
310352.2
III
333286.6
7142.2
340428.8
IV
315843
7854.7
323697.7
1993/94 I
349884.7
9136.2
359020.9
II
340749.6
8536.1
349285.7
III
334488.1
8851.9
343340
IV
333960.3
18137.4
352097.7
1994/95 I
356084.8
9133.3
365218.1
II
351282.6
8129.2
359411.8
III
357659.9
9038.1
366698
IV
351407.1
8961.8
360368.9
Period
Hydro
Power
Thermal
Power
Geothermal
Total (KWH)
1995/96 I
382147
9918
392065
II
369233.7
10435.7
379669.4
III
379030.4
10689.1
389719.5
IV
376799.8
11138.8
387938.6
1996/97 I
407634
11733
419367
II
386851
11356
398207
III
387899.1
12063.5
399962.6
IV
383280.1
12358.3
395638.4
1997/98 I
400578.9
13562.6
414141.5
II
398467.9
12511
410978.9
III
397923.2
12885.5
0
410808.7
IV
381598.2
9609.8
0
391208
1998/99 I
425811.5
5431.6
6601.2
437844.3
II
406912.1
4500.6
23265.9
434678.6
III
383702.7
4955.1
6809.2
395467
IV
383741
5036.5
6622.5
395400
1999/00 I
425842
5389.3
8265.2
439496.5
II
407052.7
5387.4
6579.7
419019.8
III
412246.8
4591.9
2673.4
419512.1
IV
388581.1
6981.8
2474.5
398037.4
2000/01 I
428131.1
4606.6
2905.6
435643.3
II
442173.1
3836.9
444.1
446454.1
III
444870
4294
1695
450859
IV
462680.9
3738.2
29.1
466448.2
2001/02 I
494953.6
4075.2
0
499028.8
II
492722.5
4202.2
0
496924.7
III
491337.1
3983.4
0
495320.5
IV
494953.6
4075.2
0
499028.8
2002/03 I
519779.2
4711
524490.2
II
677831.2
10732.1
688563.3
III
498354.4
0
0
498354.4
Appendix
F: Number and Capital of Investment Projects Approved (millions of Birr) and
Employment Creation
Total
Domestic
(private)
Foreign
Public
Period
No
Capital
Emp’t
No
Domestic
Emp’t
No
Foreign
Emp’t
No
Public
Emp’t
1997/98:Q
I
284
2191.2
17999
266
1810.5
16536
18
380.7
1463
Q.II
172
1783.8
9898
158
-224.7
8423
14
2008.5
1475
Q.III
191
1986.7
19838
160
914.1
10906
31
1072.6
8932
Q.IV
223
1715.5
17556
205
1116.6
14876
18
598.9
2680
1998/99:Q.I
265
1010.8
16934
257
746.6
15906
8
264.2
1028
Q.II
166
4727.9
16328
160
4157.5
15823
6
570.4
505
Q.III
137
1020.14
10348
129
721.12
7959
8
299.02
2389
QIV
135
1198.21
8755
127
947.41
8088
8
250.8
667
1999/00:Q.
I
163
4365
11892
145
989.5
10326
14
397.3
1150
4
2978.2
416
Q.II
144
2962.98
21006
129
2957.39
19269
14
430.61
1737
1
2574.98
0
Q.III
155
1630.25
17719
145
963.29
13253
7
493.71
4455
3
173.25
11
QIV
158
2155.42
40046
140
1786.87
8130
17
335.16
31896
1
33.39
20
2000/01:Q.
I
177
1,330.41
8827
166
1,035.34
7190
8
276.54
1581
3
18.5307
56
Q.II
185
1787.421
13026
172
1198.067
9520
12
576.8549
3468
1
12.4987
38
Q.III
176
2866.1
14211
166.00
1662.9
13,086
8
1,054
1,071
2
149
54
QIV
143
2687.98
9161
129
1677.92
7093
13
932.89
1628
1
77.17
440
2001/02:Q.
I
186
2712.005
17814
175.00
1955.848
12836
9
739.4118
3906
2
16.7454
1072
Q.II
203
2071.3
15263
186
1542.995
12418
12
257.823
2232
5
270.482
613
Q.III
213
2756.332
9547
206
1339.206
8342
5
178.7089
753
2
1238.417
452
QIV
192
1587.83
11287
183
1223.66
7333
8
290.9804
3919
1
73.1899
35
2002/03:Q.
I
308
3263.06
17644
294
1915.41
15,910.00
14
1347.7
1734
0
0
0
Q.II
259
3536.07
17734
249
3123.29
16691
10.00
412.78
1043
0
0
0
Q.III
310
2691.91
15492
280
2126.48
11848
30.00
565.43
3644
0
0
0
Q.IV
256
3691.62
17288
219
1970.96
9039
32
1114.52
8110
5
606.14
139
[1] To
capture the relative quarter specific price stability, the inflation rate of a
quarter for successive years is used. For example, the figure 0.8 for the first
quarter is calculated as a six year average of percentage changes between
average CPI over the first quarter of successive years.